In this post I will cover about SCCM task sequence debugger tool which comes shipped with Configuration Manager technical preview 1905 release. I am always excited to use the new tools that are baked in SCCM builds. Especially the technical preview builds. I believe the tools are the easiest way to troubleshoot the issues and fix them.
If you are following the SCCM technical preview releases, a lot of new tools have been added to technical preview version 1905. Here is my post on SCCM TP 1905 features. Among the new features and tools added in SCCM preview 1905, I wanted to test the Configuration Manager Task Sequence debugger tool.
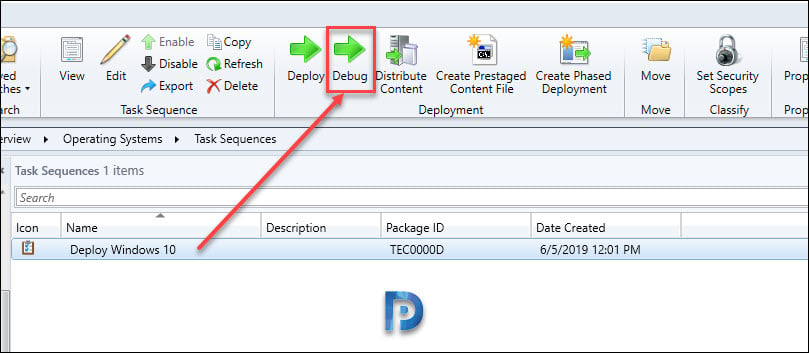
The task sequence debugger is a new troubleshooting tool in SCCM technical preview 1905. When you right-click a task sequence, you get a new option called debug. You deploy a task sequence in debug mode to a device collection. When you PXE boot the client computer, it lets you step through the task sequence to aid troubleshooting and investigation.
First of all remember that the debugger tool currently only works in Windows PE. So you must first deploy the task sequence in debug mode and only then you can use it.
Since Configuration Manager Task Sequence debugger tool is still not added to current branch builds yet, you may test this tool in your lab setup. I have used this tool in my setup and it works well.
SCCM Task Sequence Debugger Tool
To use the SCCM Task Sequence debugger
- In the Configuration Manager console, go to the Software Library>Operating Systems.
- Select Task Sequences.
- Select a task sequence. In the Deployment group of the ribbon, select Debug.
- Follow the steps in the wizard and deploy the TS to a device collection.
- PXE boot the client and the SCCM Task Sequence debugger tool should appear.
Here is how the SCCM debugger tool looks. Note that you can still press F8 key and launch command prompt. Debugger tool doesn’t restrict that in anyway.
Let me cover some debugger controls.
- Step – Runs the next step in the task sequence.
- Run – Runs the task sequence normally to the end or the next break point from current position.
- Set Current – This control allows you to skip steps or move backwards. To use this you must first select a step in the debugger and then select Set Current. This action moves the current pointer to that step.
- Set Break – This control adds a break point in the debugger. You select a step and click Set Break.
- Quit – Use this option to quit the debugger and halt the TS.


